

The key economic reports this week are August Housing Starts and Retail Sales.
For manufacturing, August Industrial Production, and the September New York and Philly Fed surveys, will be released this week.
The FOMC meets this week, and no change to policy is expected.
No major economic releases scheduled.
8:30 AM ET: The New York Fed Empire State manufacturing survey for September. The consensus is for a reading of 5.9, up from 3.7.
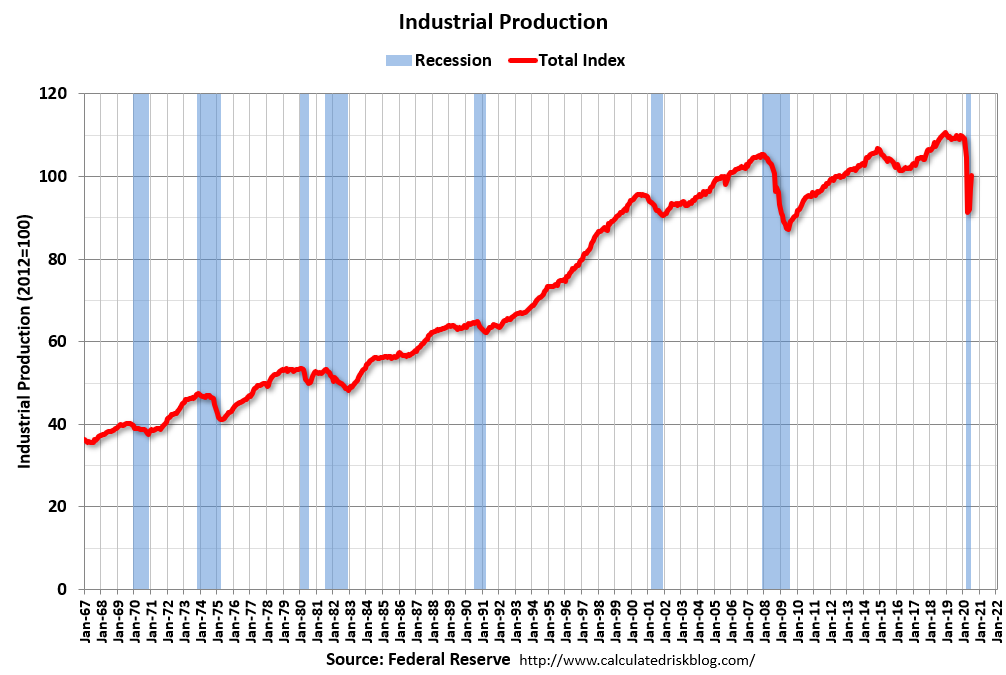 9:15 AM: The Fed will release Industrial Production and Capacity Utilization for August.
This graph shows industrial production since 1967.
The consensus is for a 1.0% increase in Industrial Production, and for Capacity Utilization to increase to 71.5%.
7:00 AM ET: The Mortgage Bankers Association (MBA) will release the results for the mortgage purchase applications index.
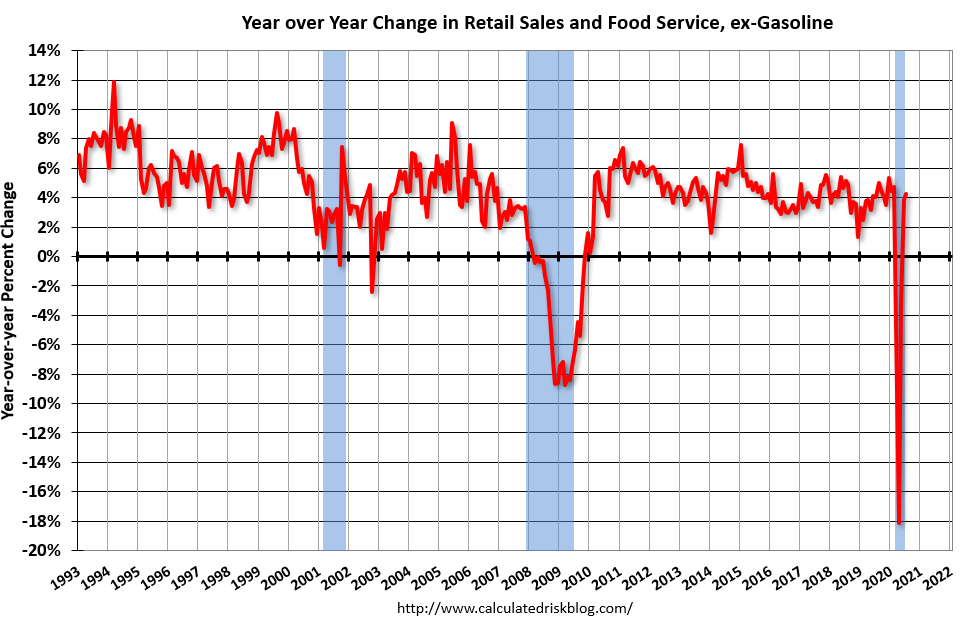 8:30 AM ET: Retail sales for August will be released. The consensus is for a 1.0% increase in retail sales.
This graph shows the year-over-year change in retail sales and food service (ex-gasoline) since 1993. Retail and Food service sales, ex-gasoline, increased by 4.2% on a YoY basis in July.
10:00 AM: The September NAHB homebuilder survey. The consensus is for a reading of 78, unchanged from 78 in August. Any number above 50 indicates that more builders view sales conditions as good than poor.
2:00 PM: FOMC Meeting Announcement. No change to policy is expected at this meeting.
2:00 PM: FOMC Forecasts This will include the Federal Open Market Committee (FOMC) participants' projections of the appropriate target federal funds rate along with the quarterly economic projections.
2:30 PM: Fed Chair Jerome Powell holds a press briefing following the FOMC announcement.
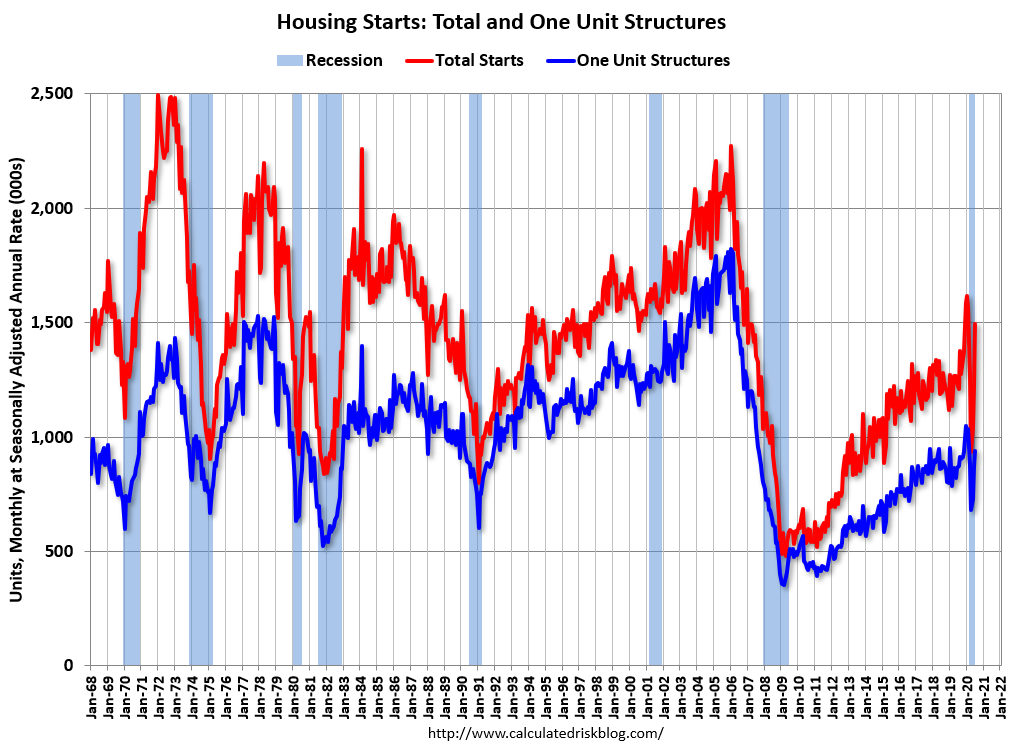 8:30 AM: Housing Starts for August.
This graph shows single and total housing starts since 1968.
The consensus is for 1.470 million SAAR, down from 1.496 million SAAR.
8:30 AM: The initial weekly unemployment claims report will be released. The early consensus is for a 900 thousand initial claims, up from 884 thousand the previous week.
8:30 AM: the Philly Fed manufacturing survey for September. The consensus is for a reading of 15.5, down from 17.2.
10:00 AM: State Employment and Unemployment (Monthly) for August 2020
10:00 AM: University of Michigan's Consumer sentiment index (Preliminary for September).